Integrated Dashboard Console
When you log into your Integrated Dashboard, you’re taken directly to the Console. The Console gives you insight into what’s been going on in your Integrated Dashboard. It displays all of your current ongoing, pending, and active integrated processes in one place. The Console also includes information related to your account such as integrated connectivity status for Tessitura and ActiveCampaign.
In this Article:
API Connection Status
The top bar of the Console provides a convenient way for you to check the current status of your integrated connectivity with the Tessitura and ActiveCampaign APIs.
You can quickly confirm the current status of both APIs by clicking the “Check API Connections” button inside the top bar on the console page.

This will trigger a controller method that will gauge the status of each API, and will return one of the following two response types for each API:
- Green / Up / Positive response and icon will display if the API is good to go.
- Red / Down / Negative response and icon will display if the API is currently experiencing issues.
Visualize Your Event Data
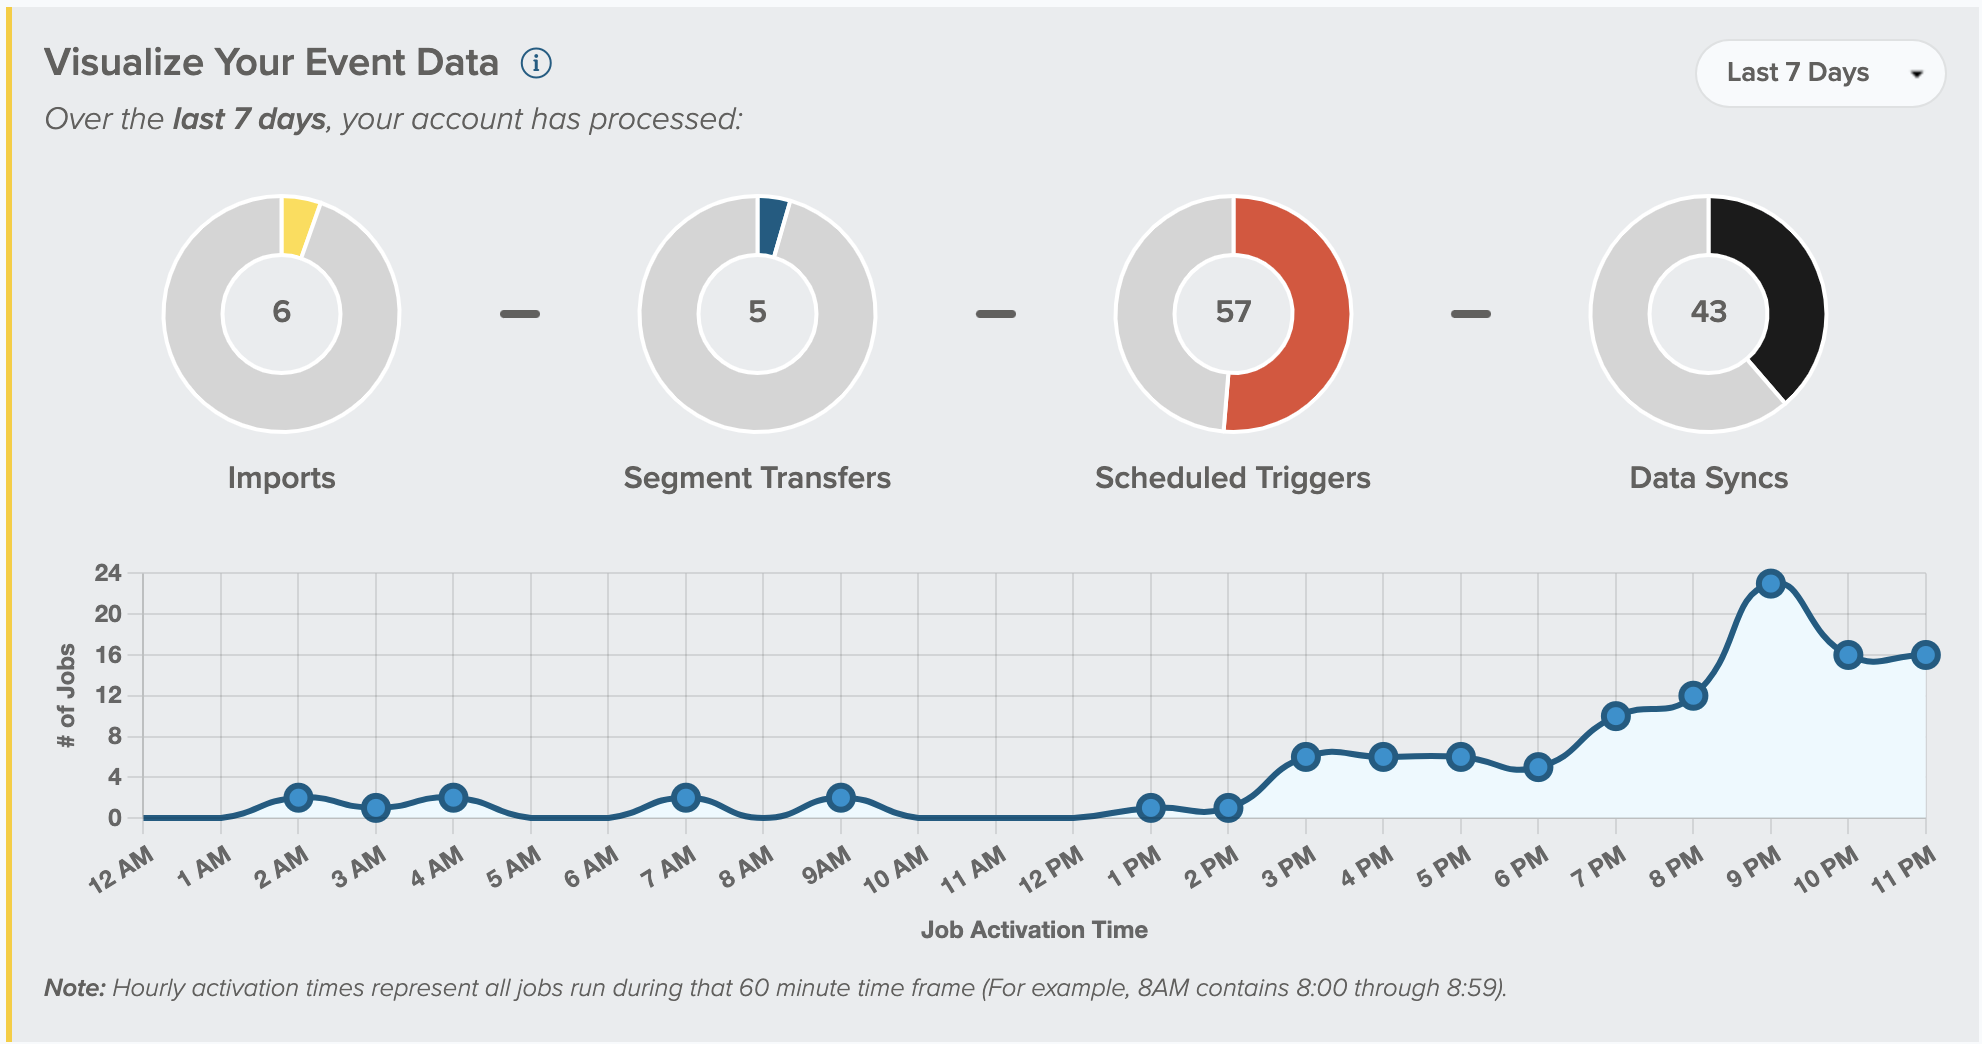
This section displays a high level overview of the number and type of integrated events that have been processed. Data will be displayed for the four major event types in Prospect2; Imports, Data Syncs, Scheduled Triggers, Segment Transfer.
This data can be used to help you determine if you have redundant integrated processes running or too many integrated processes running at the same time. If you see this, you may want to make adjustments to your scheduled jobs in order to help avoid trying to use more resources than are available in your Tessitura database with simultaneous requests.

Event Counter Charts
The Event Counter Chart displays the each of the four major event types in Prospect2. Keeping tabs on the event types that have been processed over these intervals of time can give you insight into what kind of data you are using most and may bring to light ways you can enhance or streamline your usage of the Prospect2 integration.

Activation Timing Chart
This chart provides a visualization of what time of day your events jobs are being processed. You can filter these results by the last 24 hours, 7 days, or 30 days.
This can be helpful to identify times where you have a higher amount of events scheduled to run simultaneously. We recommend staggering scheduled times when possible to ensure that either database is overburdened by the amount of requests at one time

What’s Happening Now?
This section gives you an immediate look at every major event that’s currently processing. Any Integrated Imports, Segment Transfers, Scheduled Triggers, and Data Syncs currently processing will display here.
Event Display
Events are displayed in order of processing. The longest running event will be located at the top of the listing, with any new event being added below. Processing events will display a status bar, processing notes, and event statues in real time.
Events that have been processed will remain in this section for two minutes after completion.. If you want to view this information after that has passed, it is available in the Recent Activity section of the Console page or the Activity Log for up to 30 days.

Recent Activity
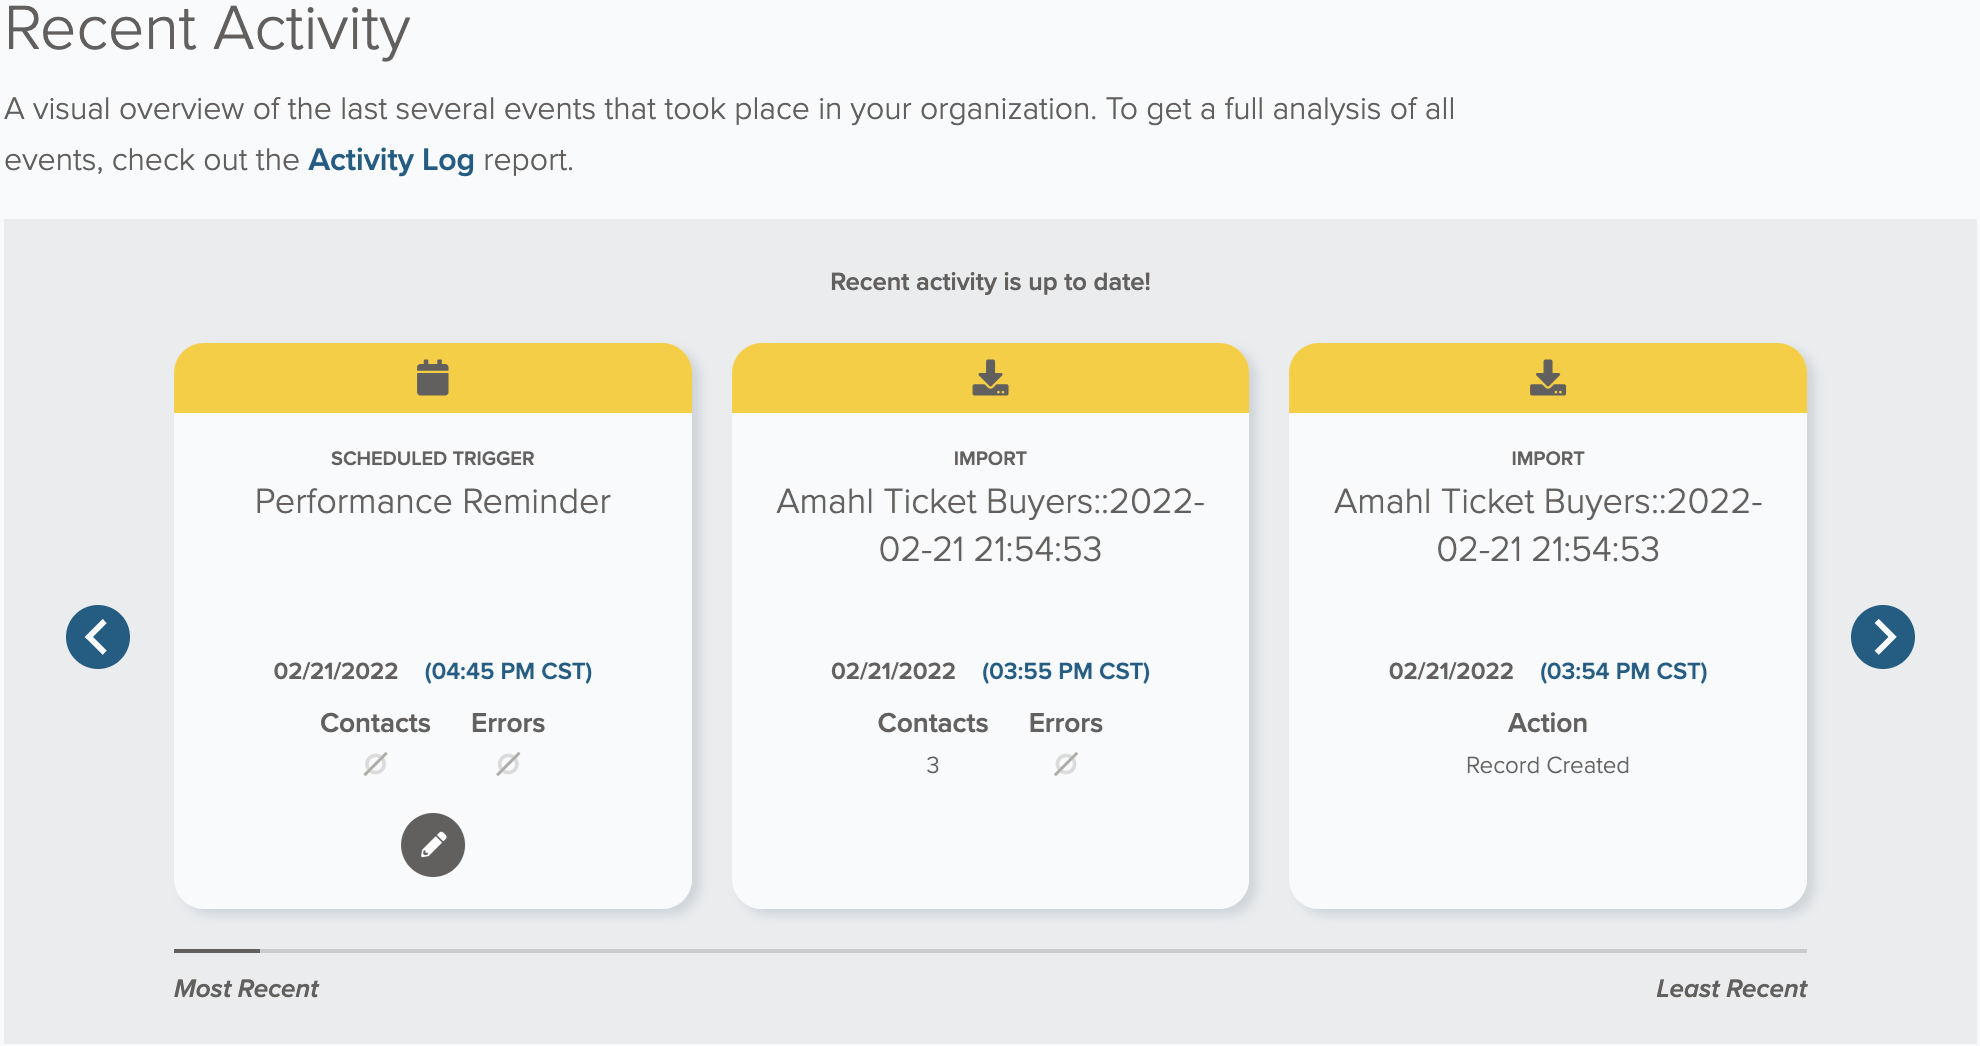
Recent Activity provides an overview of the last 20 events and activities across the entire integrated dashboard. Events and activities displayed in this section include processed events and events that have been created or edited.
Activity Display
Events are displayed with the most recently occurring on the left. To view older events, use the arrow on the right side of the carousel.
Since this widget is interactive, we do not automatically load a new event into a card as you may be taking actions or reviewing data with this section. If a new event is added while viewing this information, a message will display with a prompt to refresh to view the most up to date data for thee Recent Activity section.

Coming Up Next
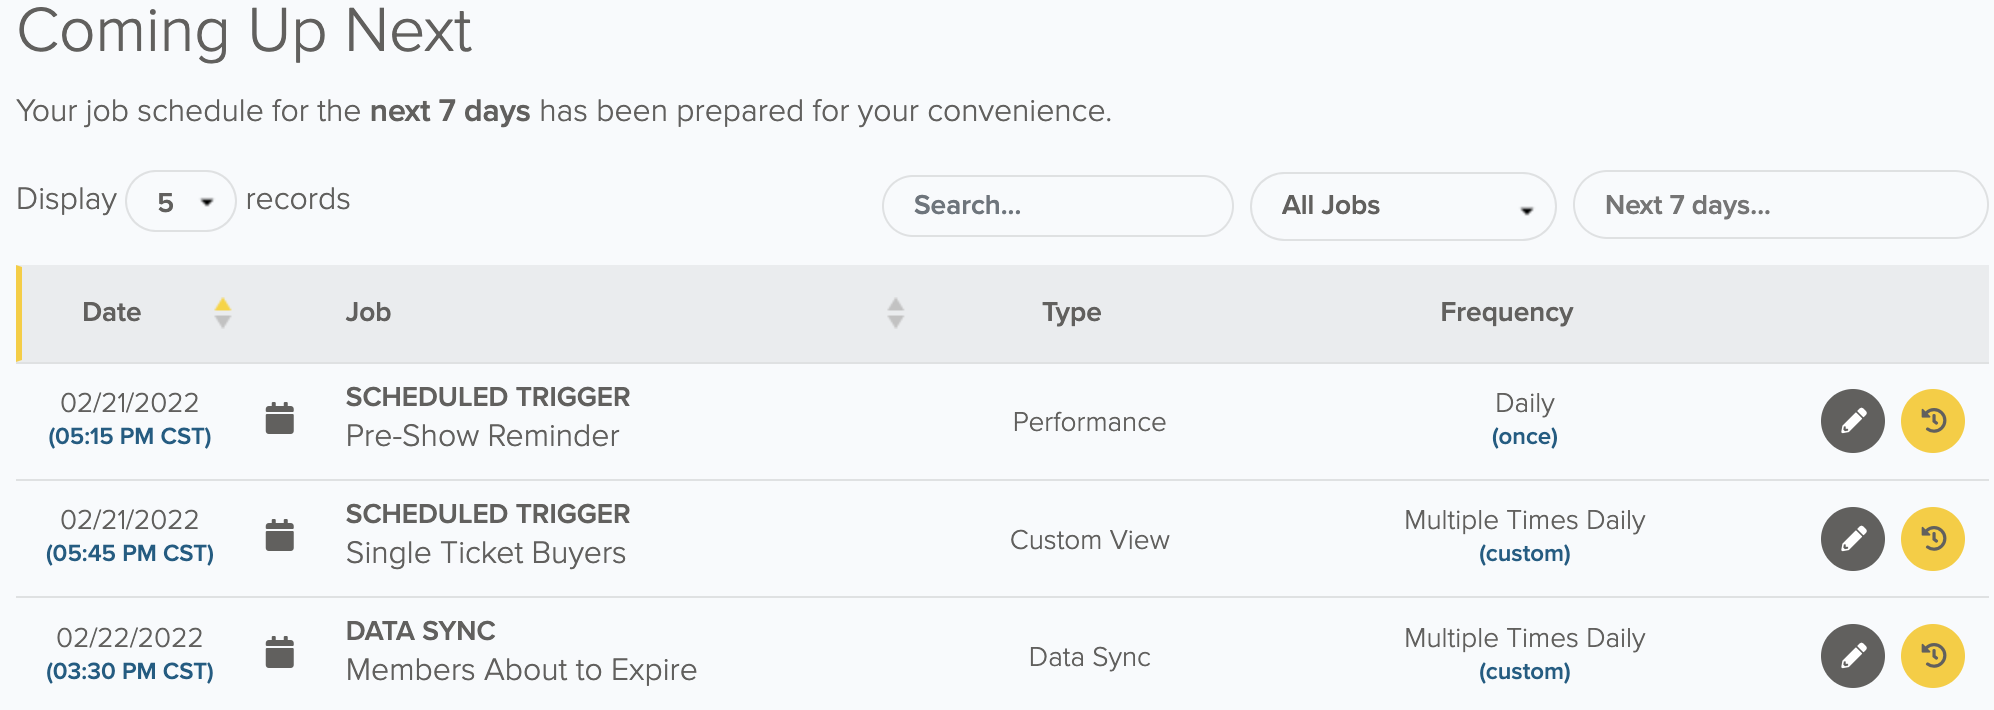
This section lists any Scheduled Triggers and Data Sync that are scheduled to run in the next 7 days. Events listed in this section may change if jobs are turned on or off, or new events are scheduled.
You can search for a specific job name, filter by job type, change the date range you wish to review upcoming events for, and more.
